PORTFOLIOS MANAGEMENT SYSTEM
PMS is a powerful tool for managing stock portfolios on one or many stock exchanges in the world. The following images are simulated figures on the two stock exchanges in Vietnam.
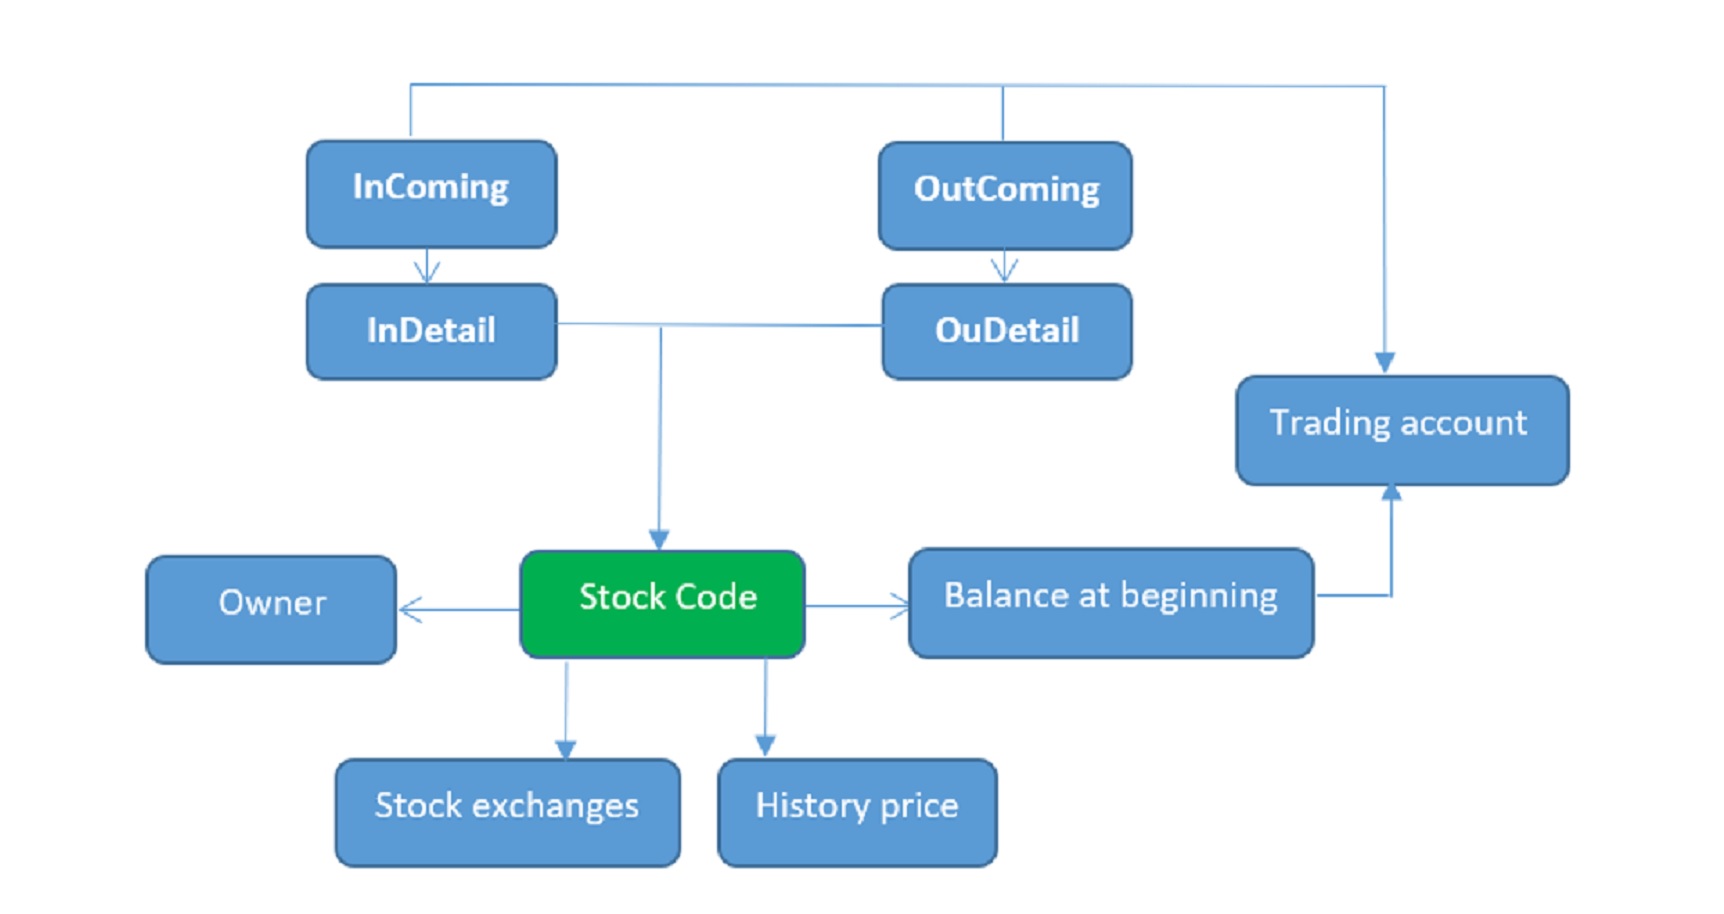
Data Structure
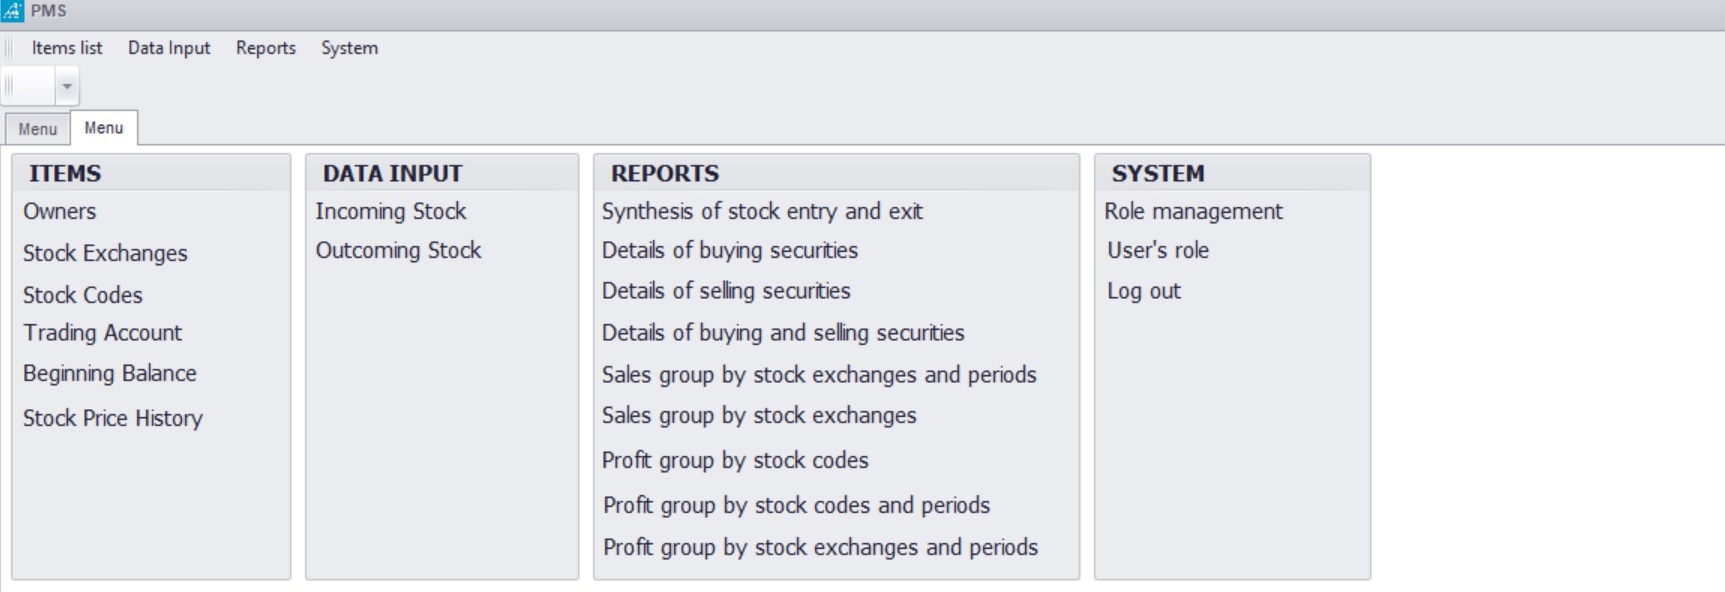
Main Menu
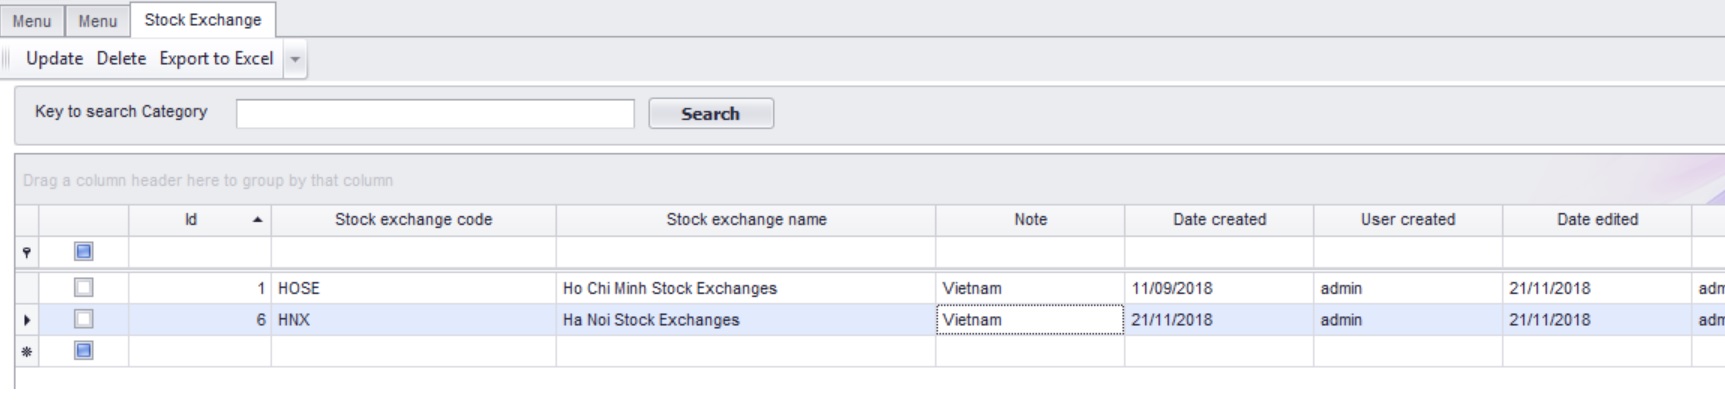
We need to declare stock exchanges that we intend to invest.
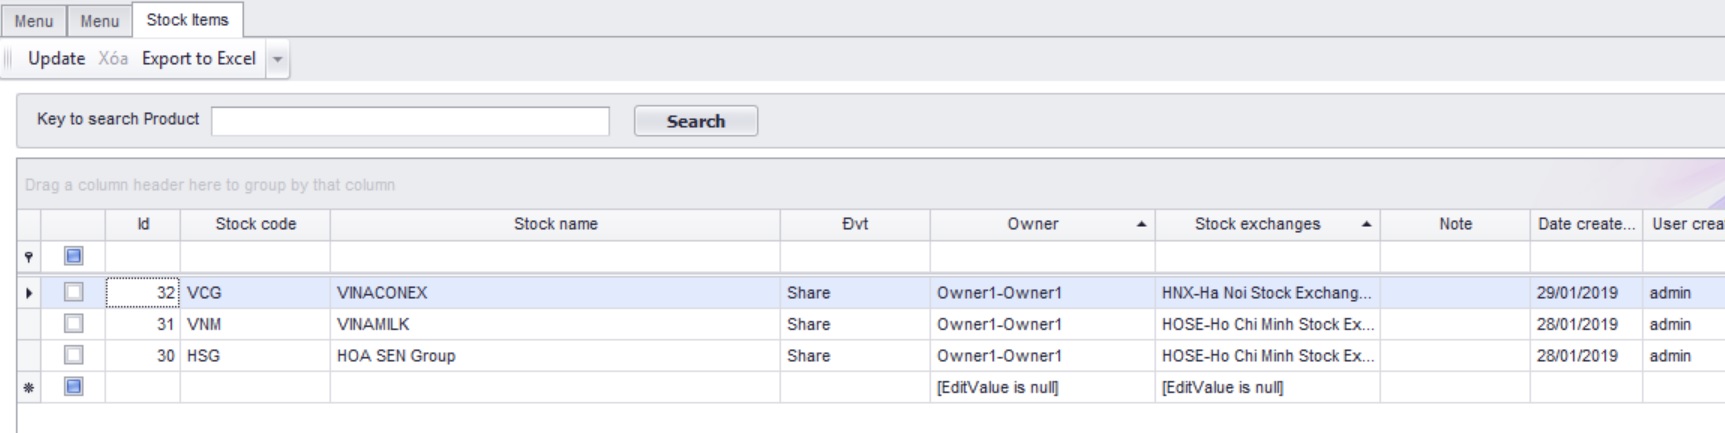
We need to declare stock codes in the portfolio.
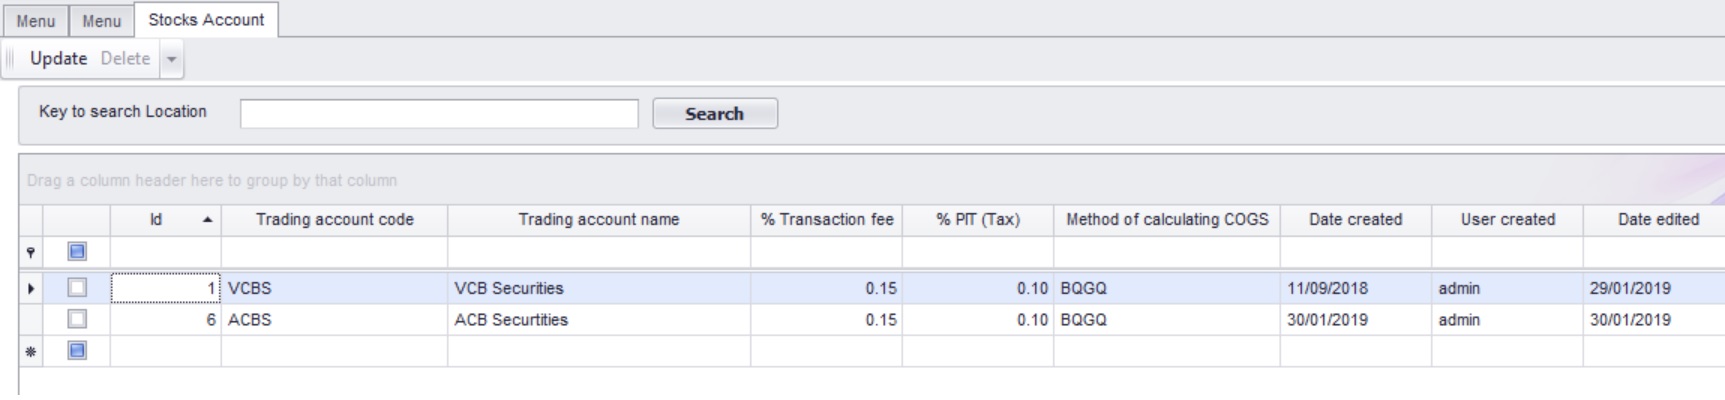
We need to declare trading accounts at securities companies.
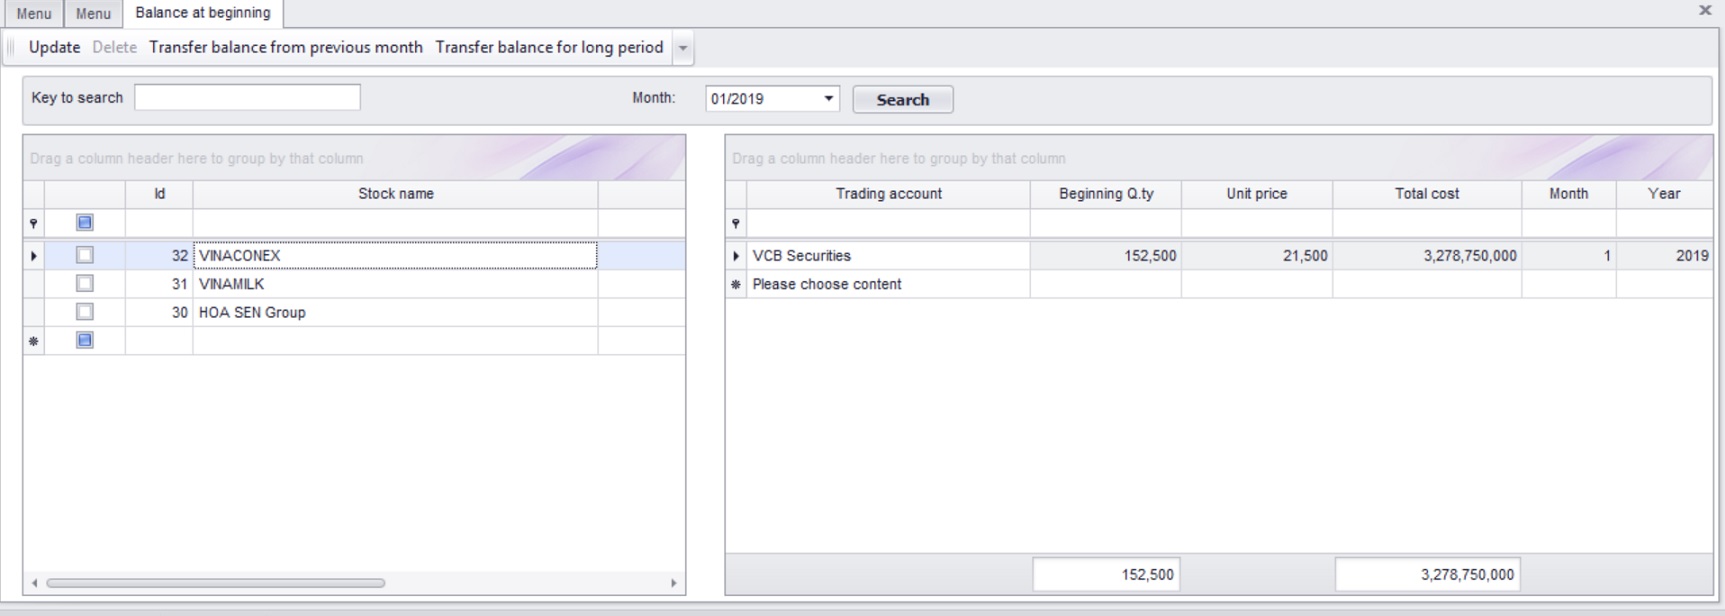
We need to declare the beginning balances when we start using this software.
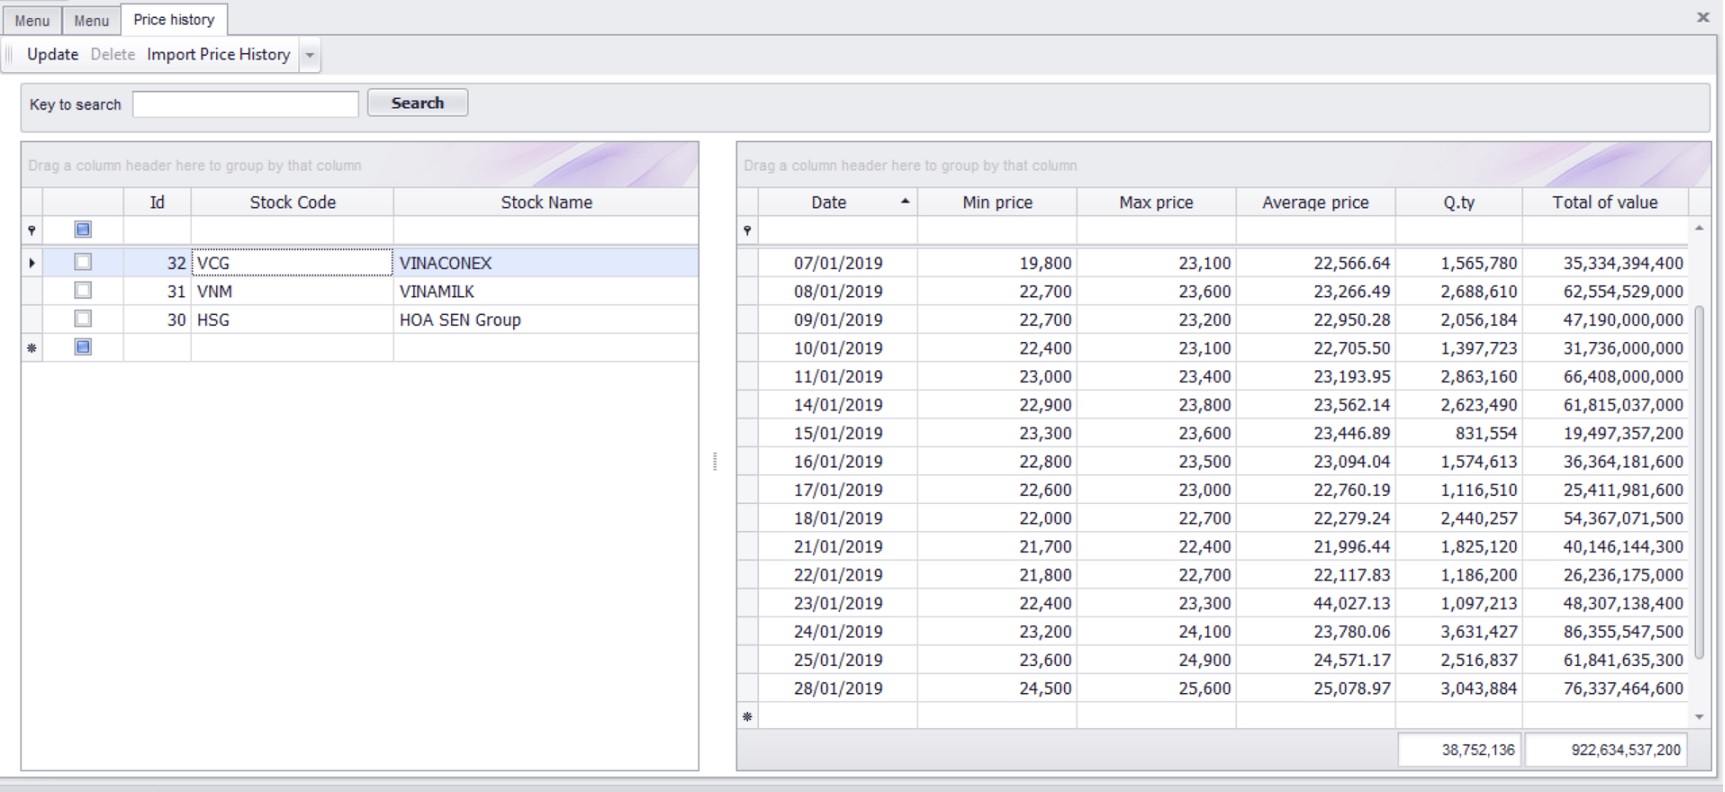
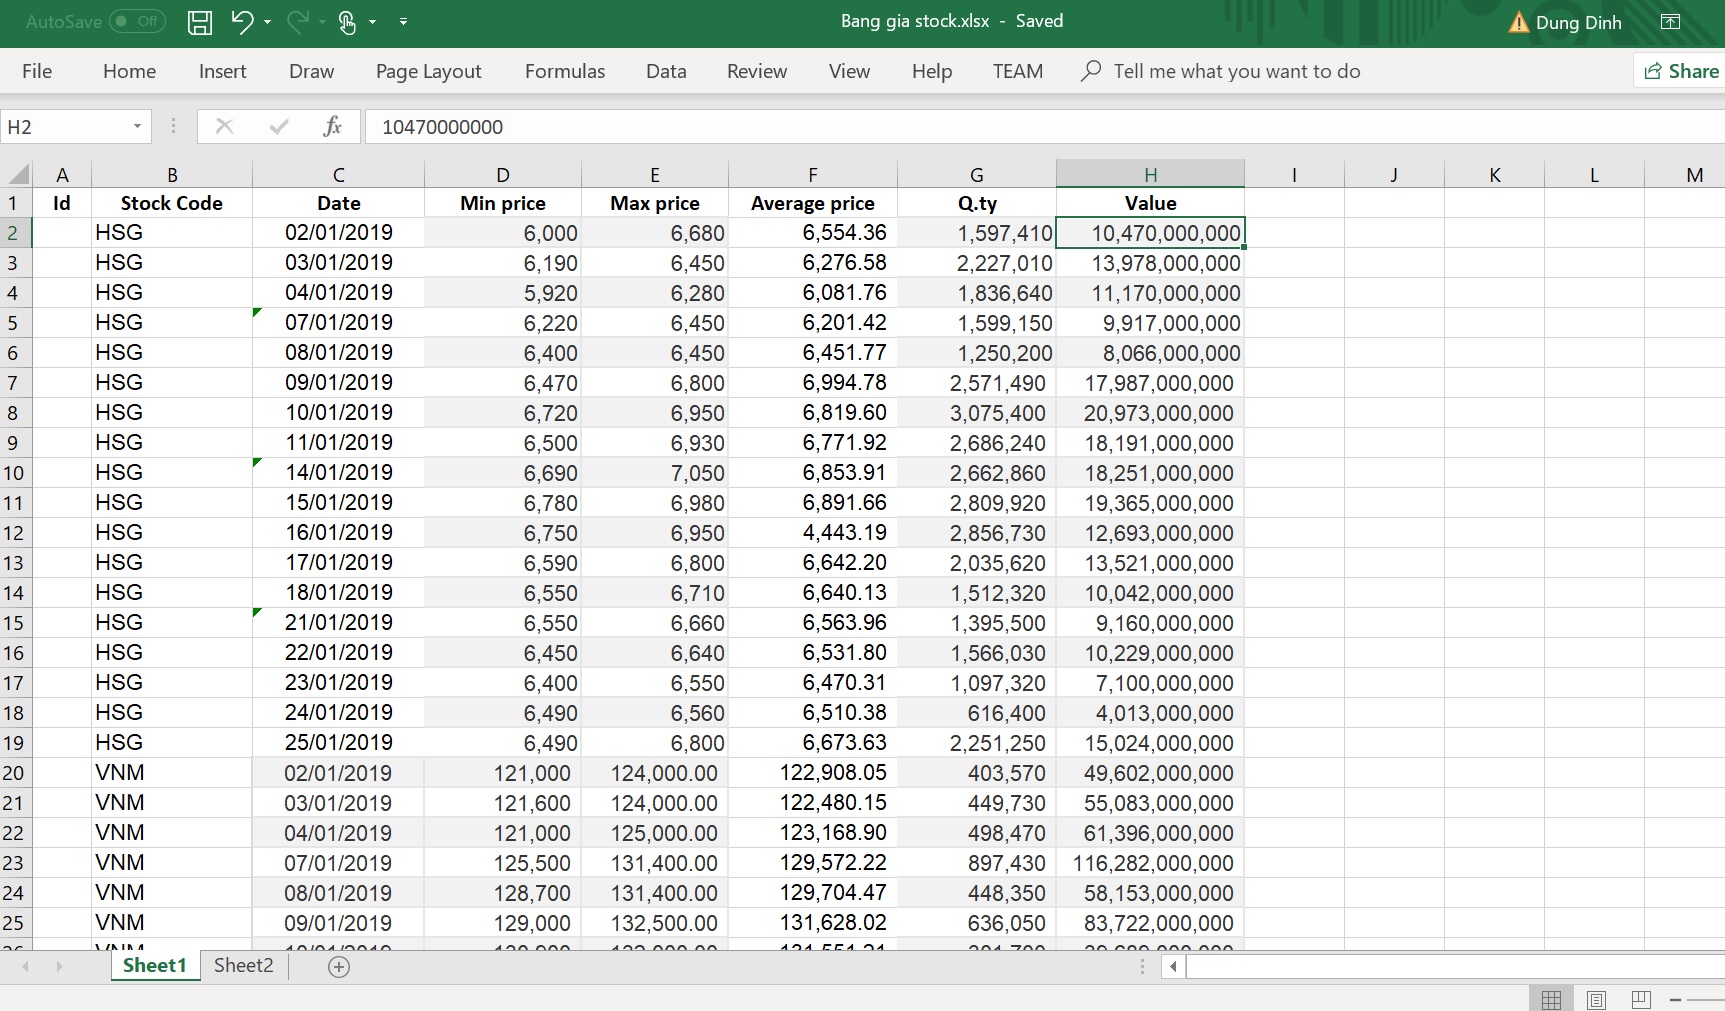
History of stock prices is for reference only. This data can be imported from stock websites on the internet. Pay attention to the buttom "Import Price History", then we point to the excel form including data ready as belows.
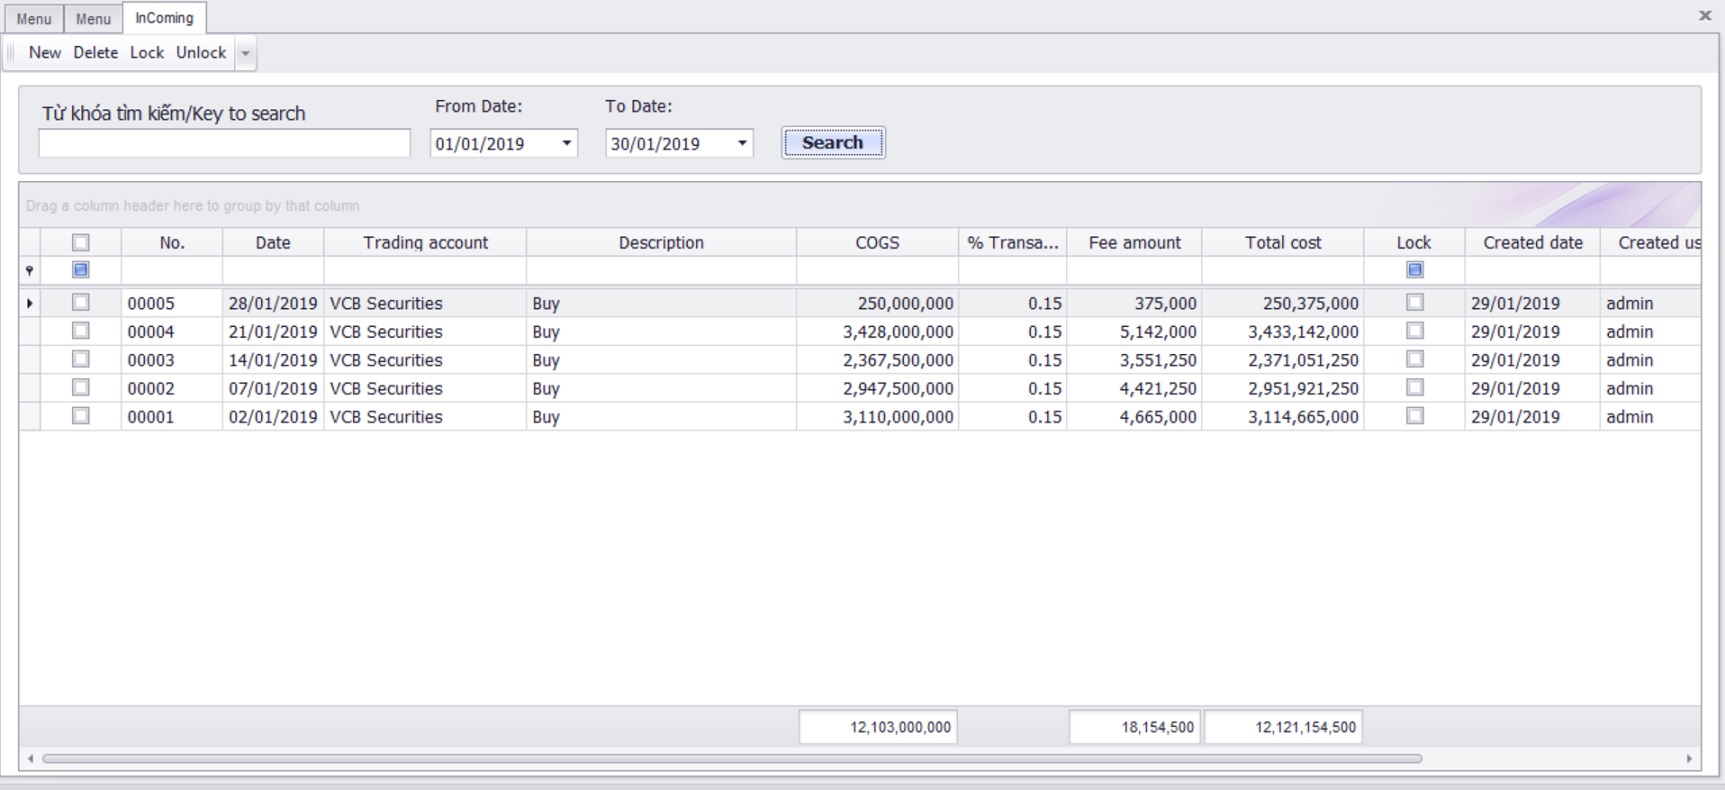
List of stocks purchased.
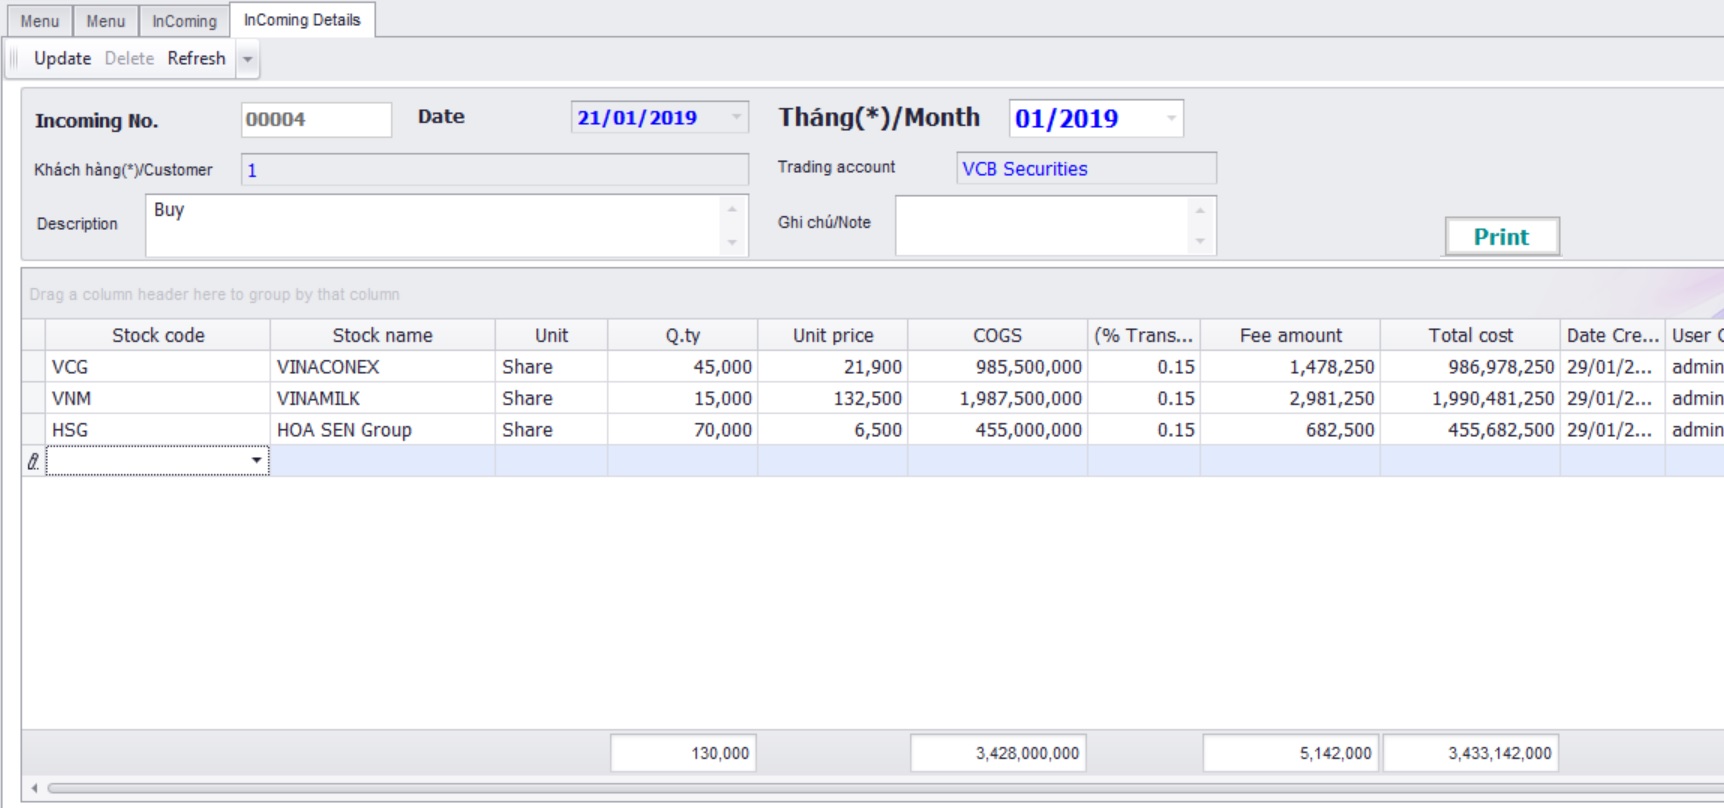
Update details of buying stocks.
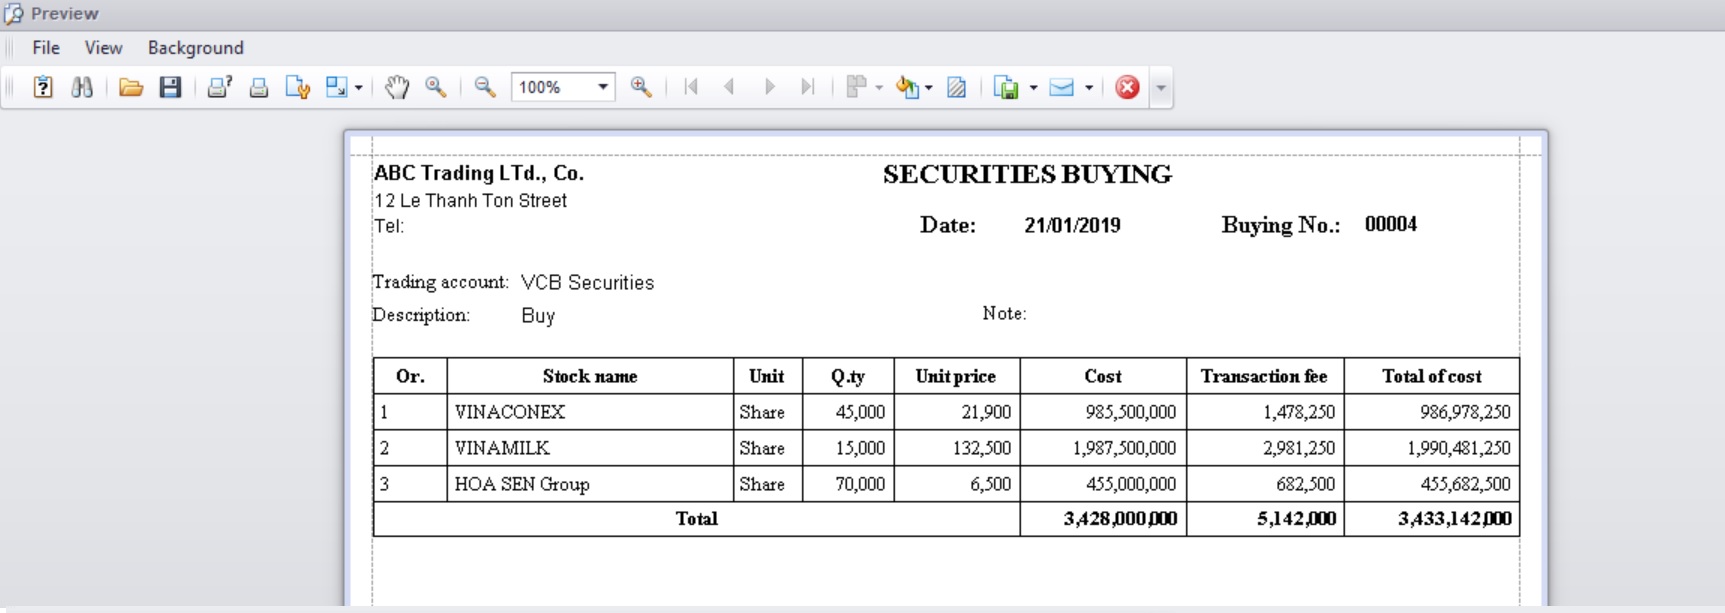
Print one sample of bill when buying stocks.
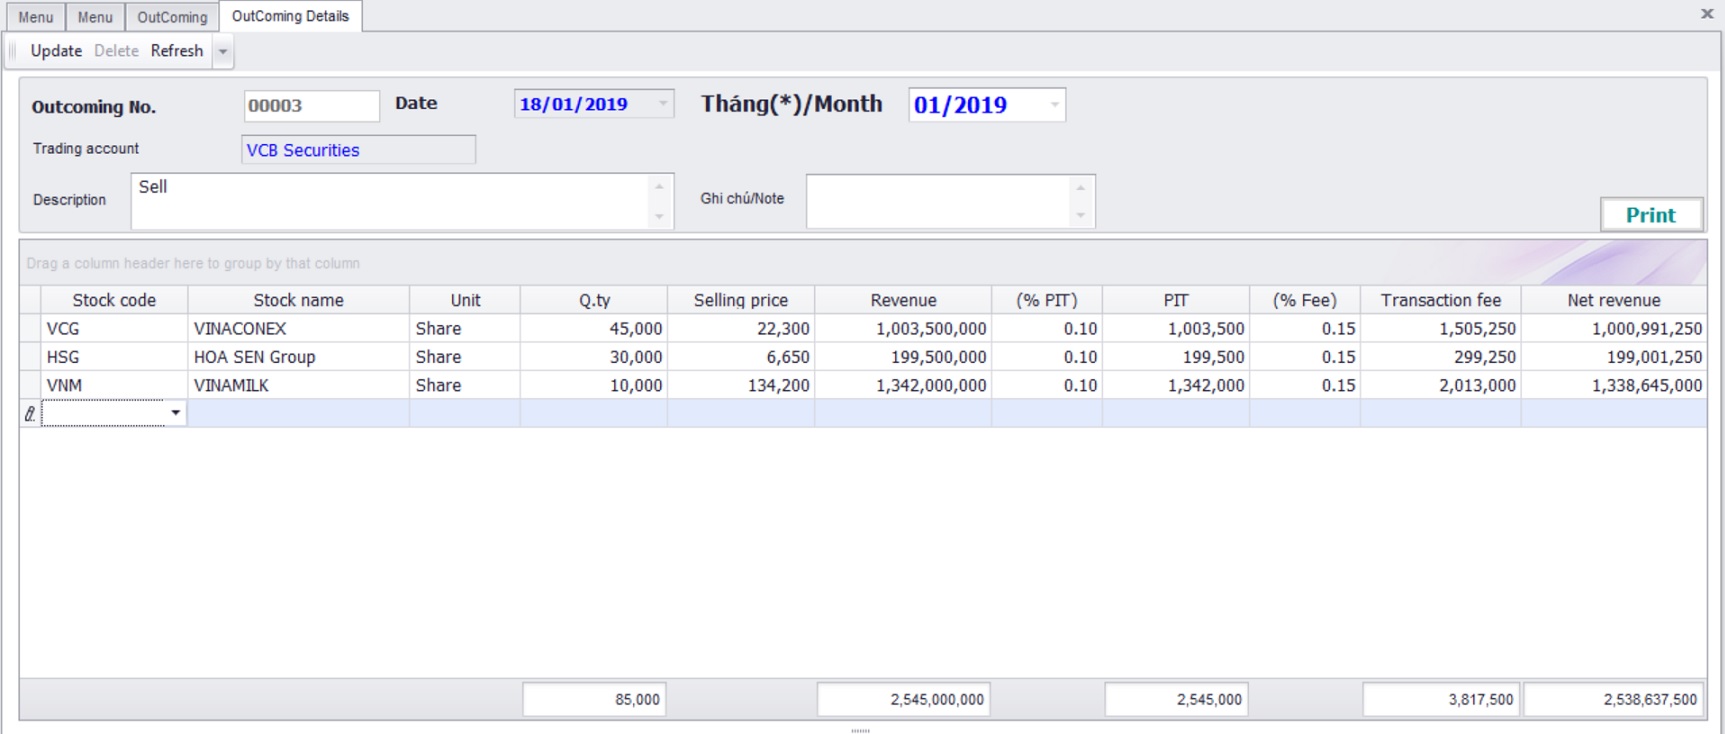
Update details of selling stocks.
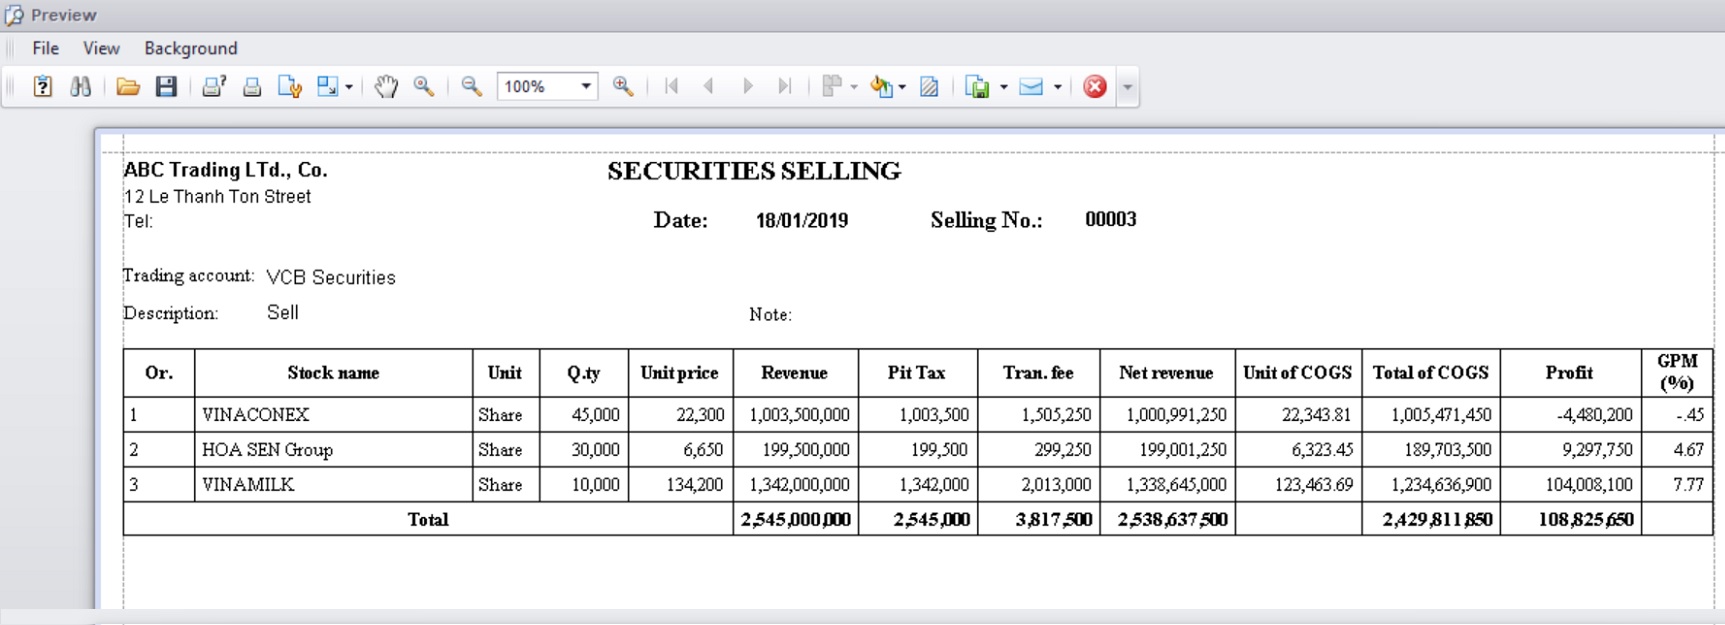
Print one sample of bill when selling stocks.
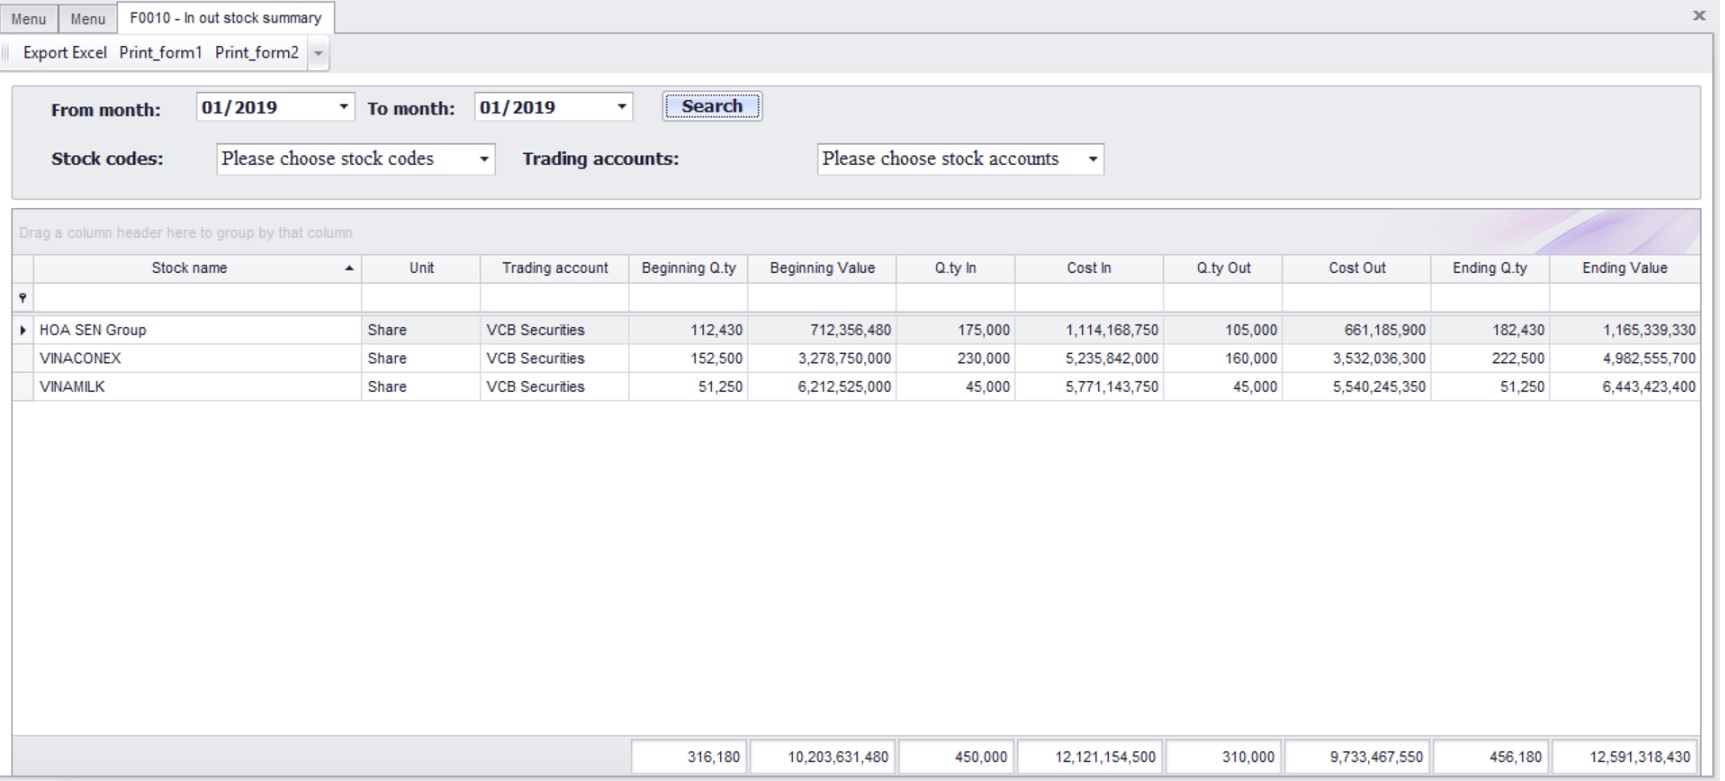
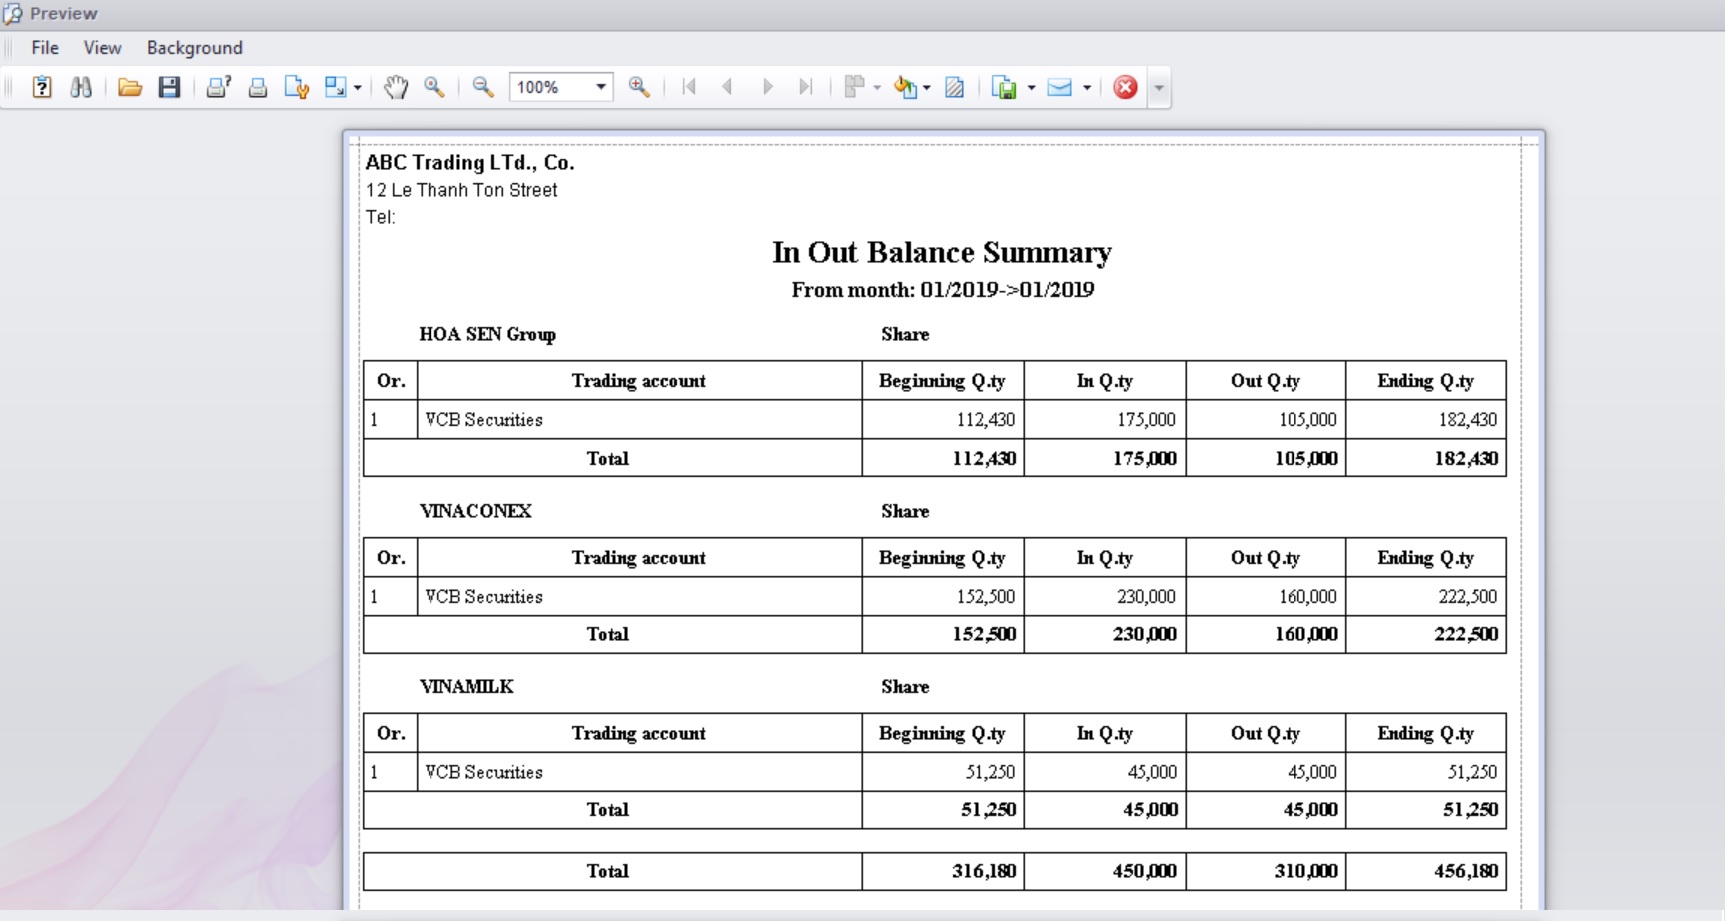
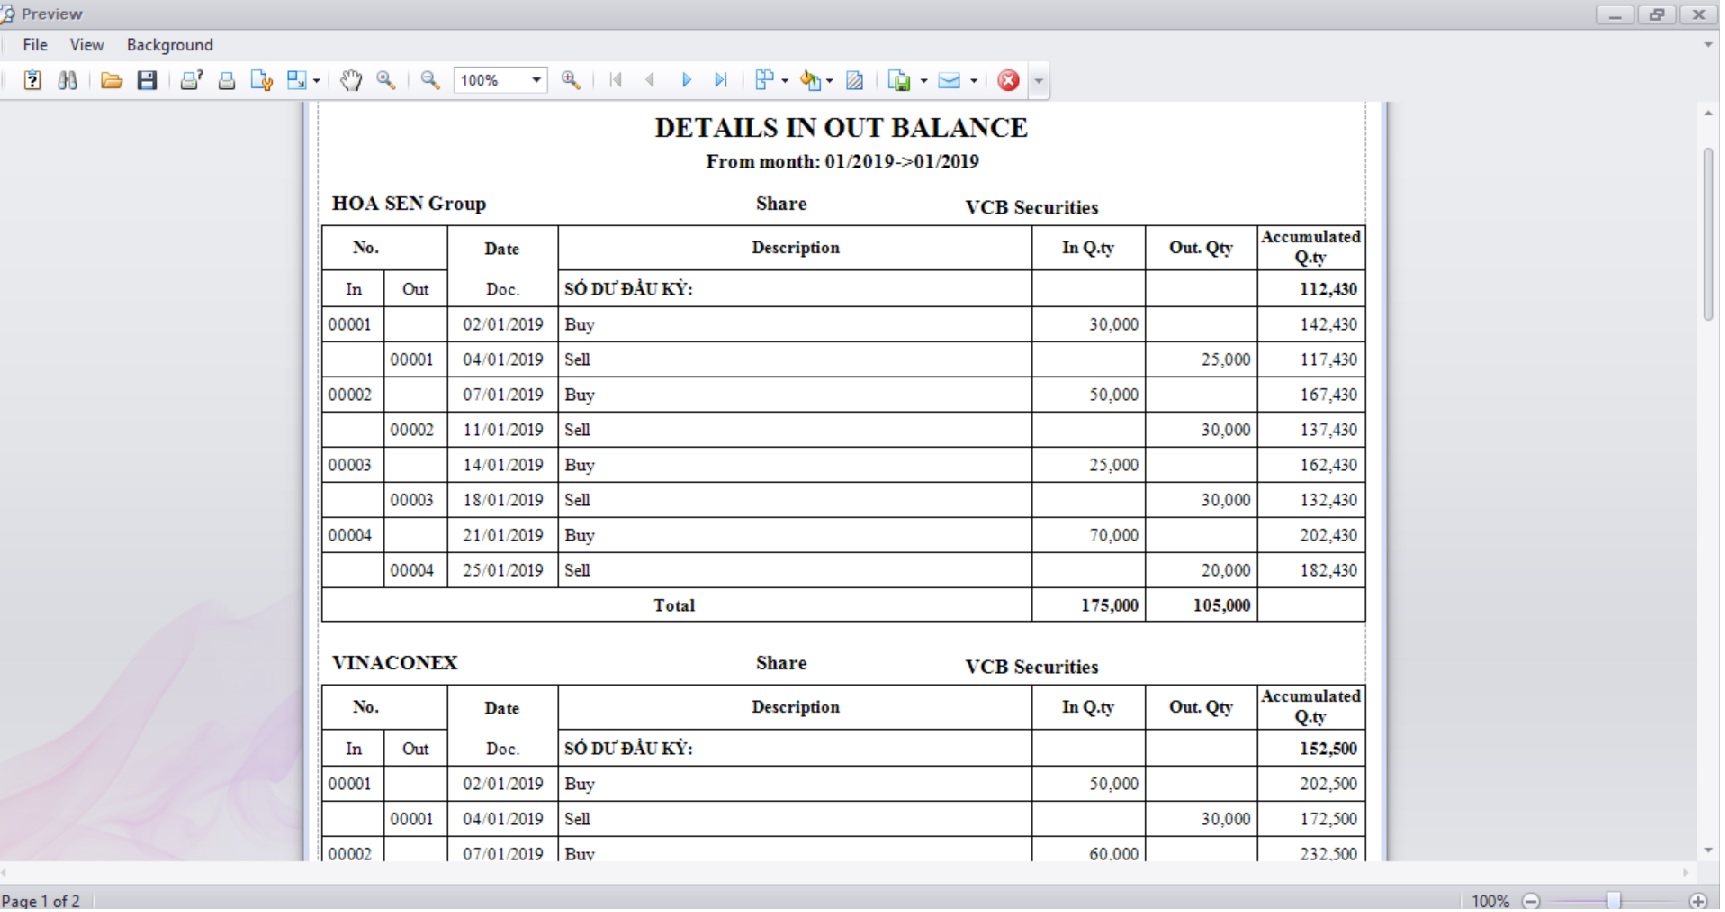
In Out Balance Stocks in Portfolios in optional period (From month -> To month).
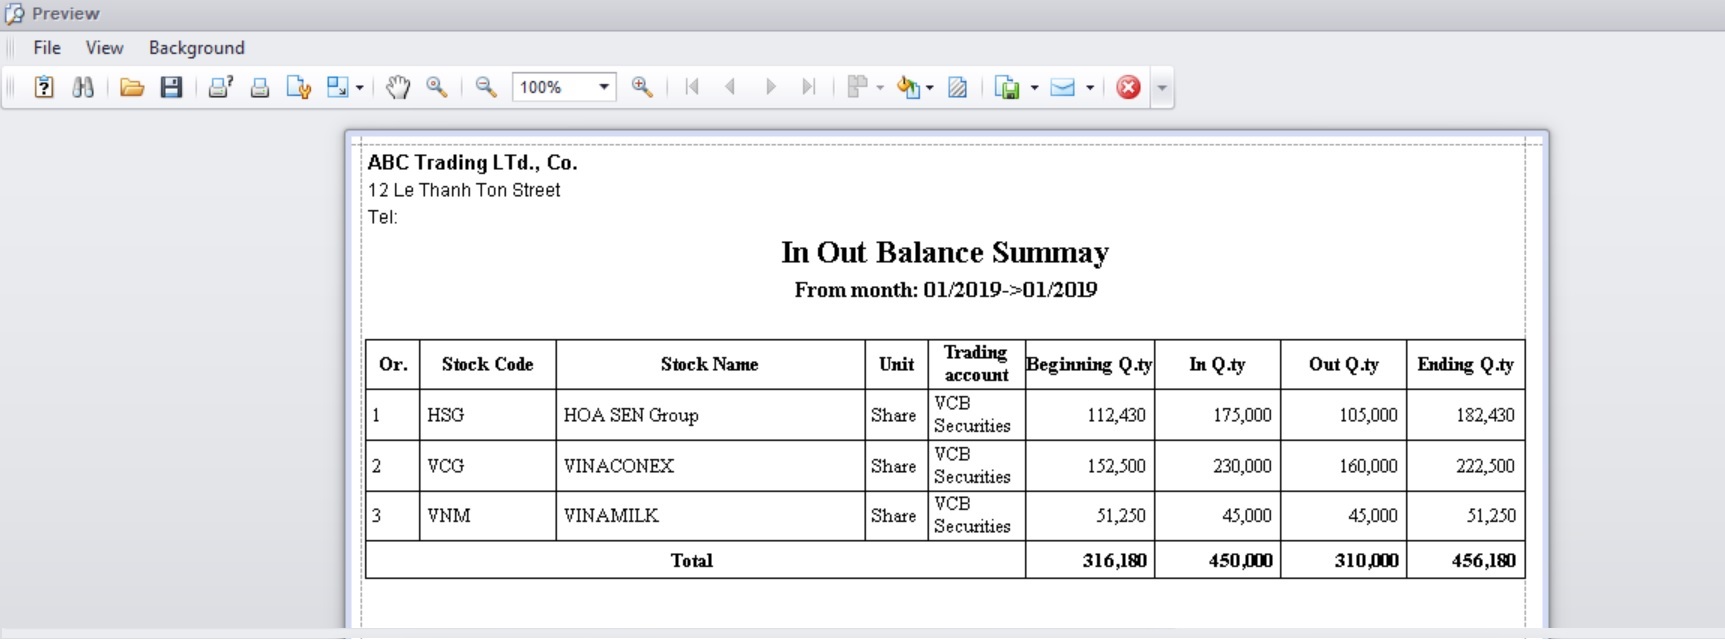
Print In Out Balance Summary by optional form1 or form2.
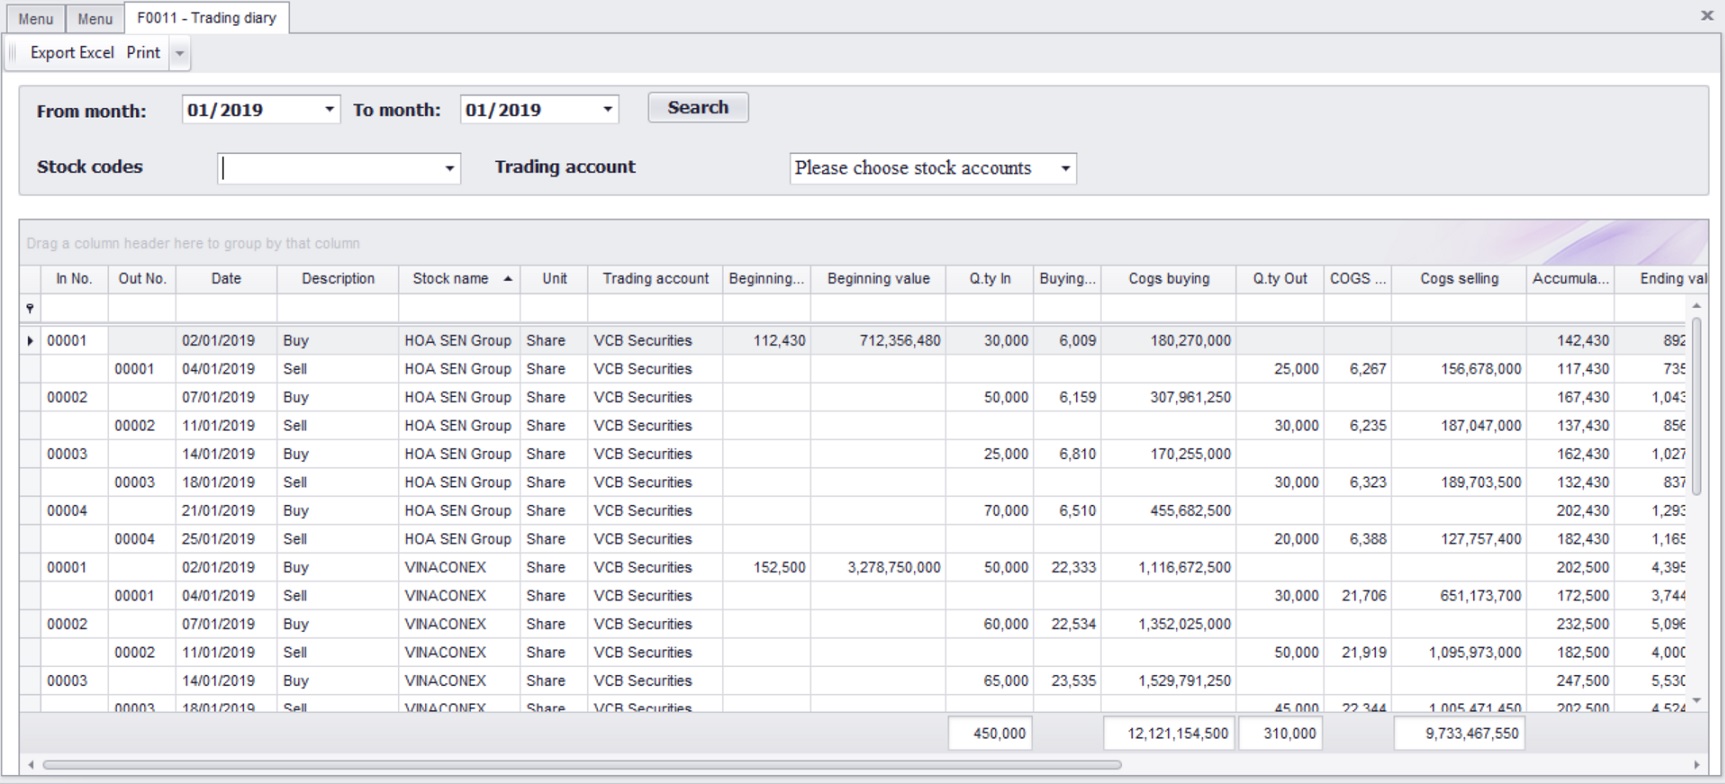
Diary of trading stocks.
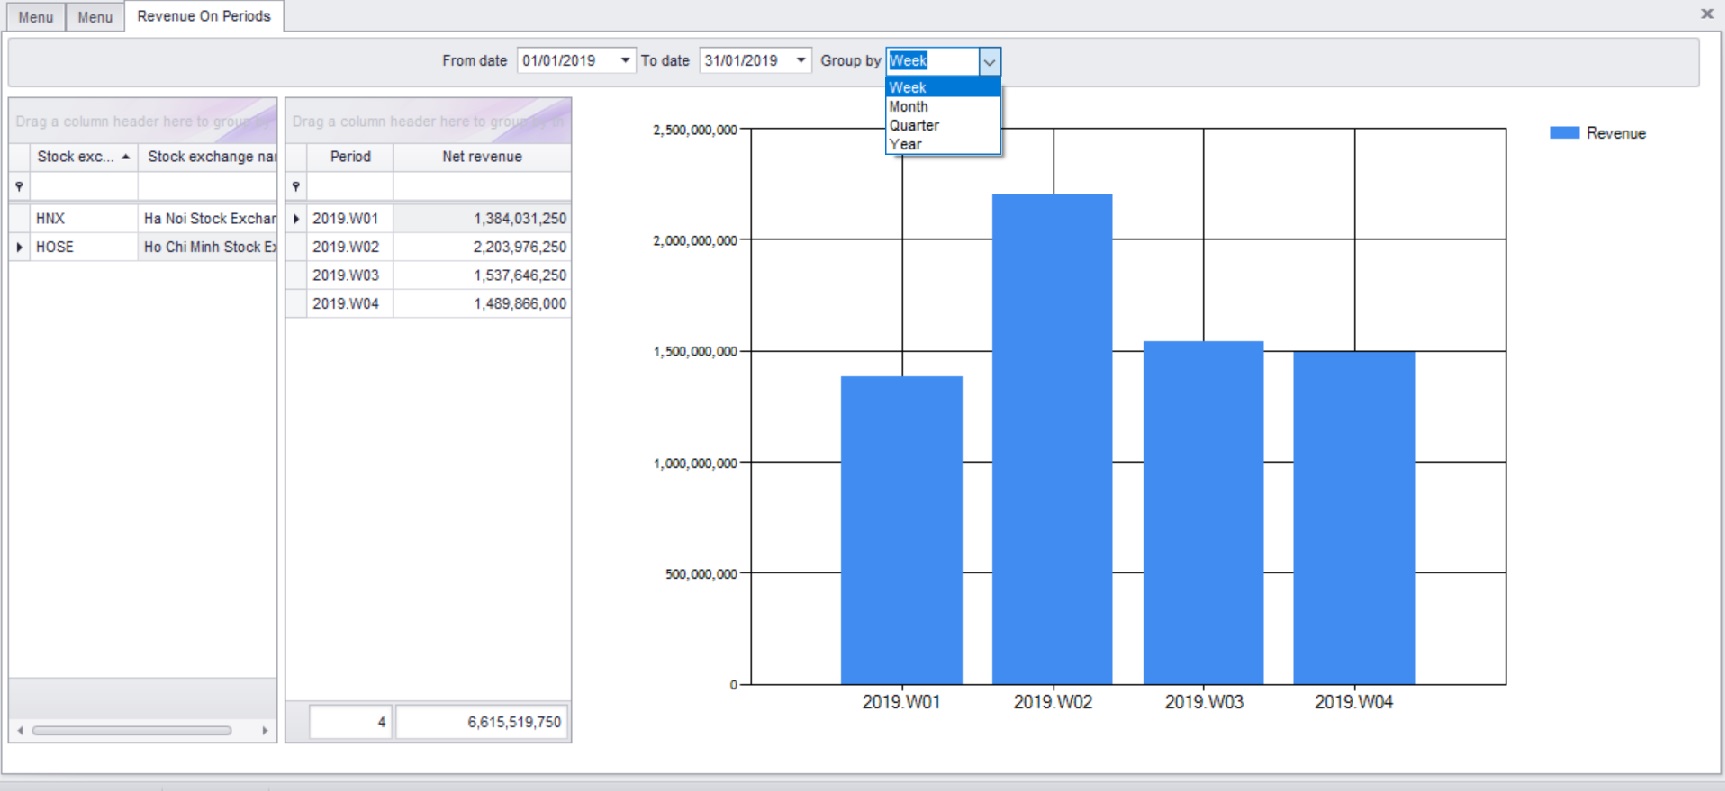
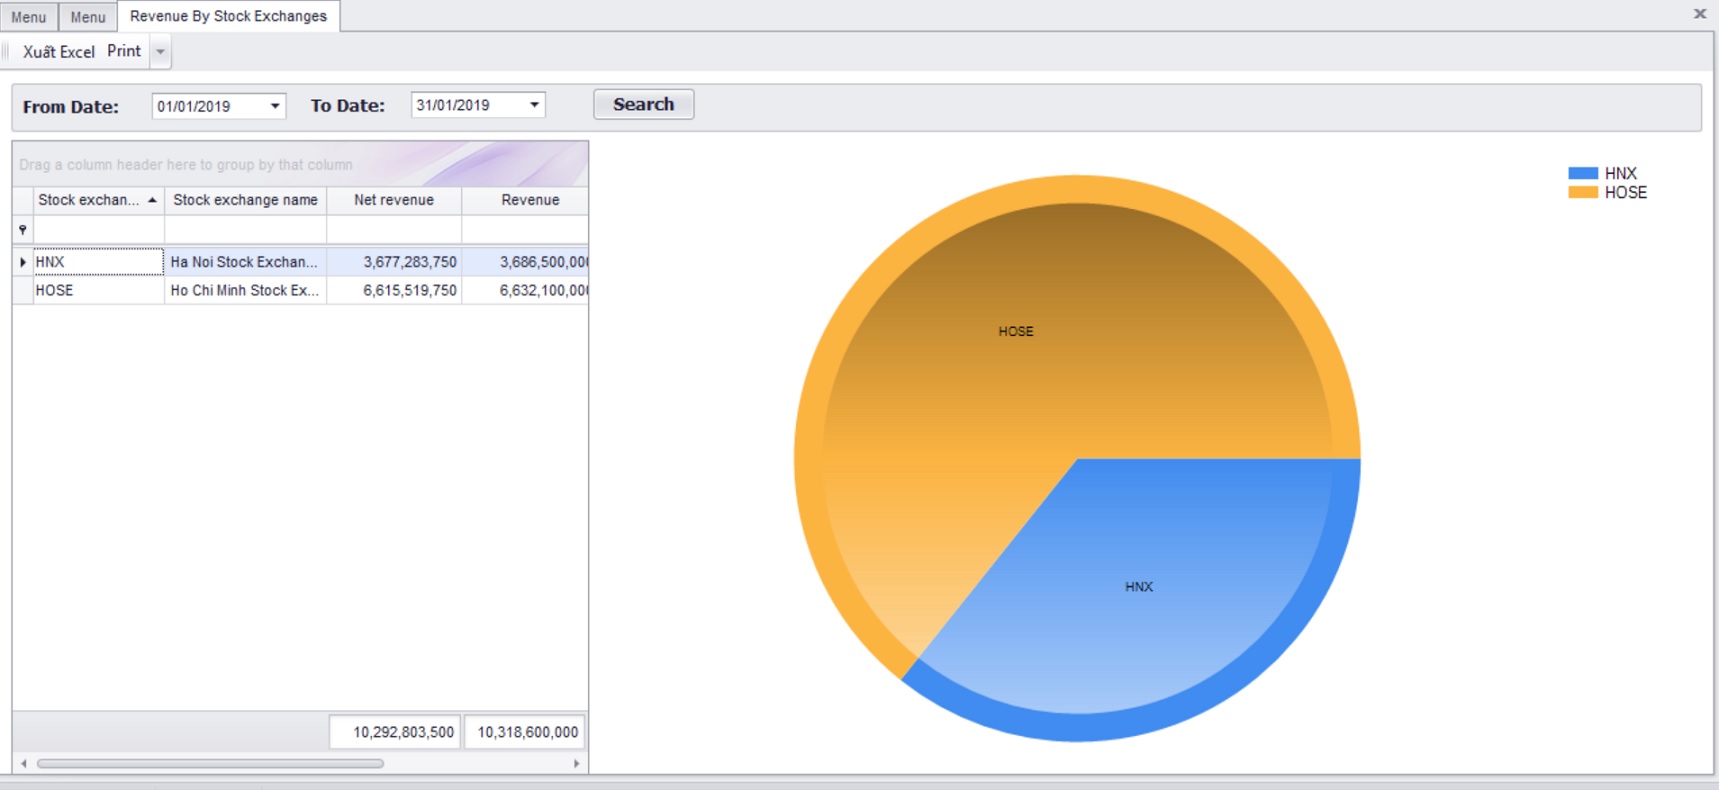
Revenue group by stock exchanges and draw chart on periods. We can browse report by 4 options: Week, Month, Quarter, Year. Here in after we choose the option by week as belows.
Revenue group by stock exchanges and draw chart describing the proportion of transactions on each stock exchange within a certain period of time.
Analyzing the profit of each stock code in a certain period of time.
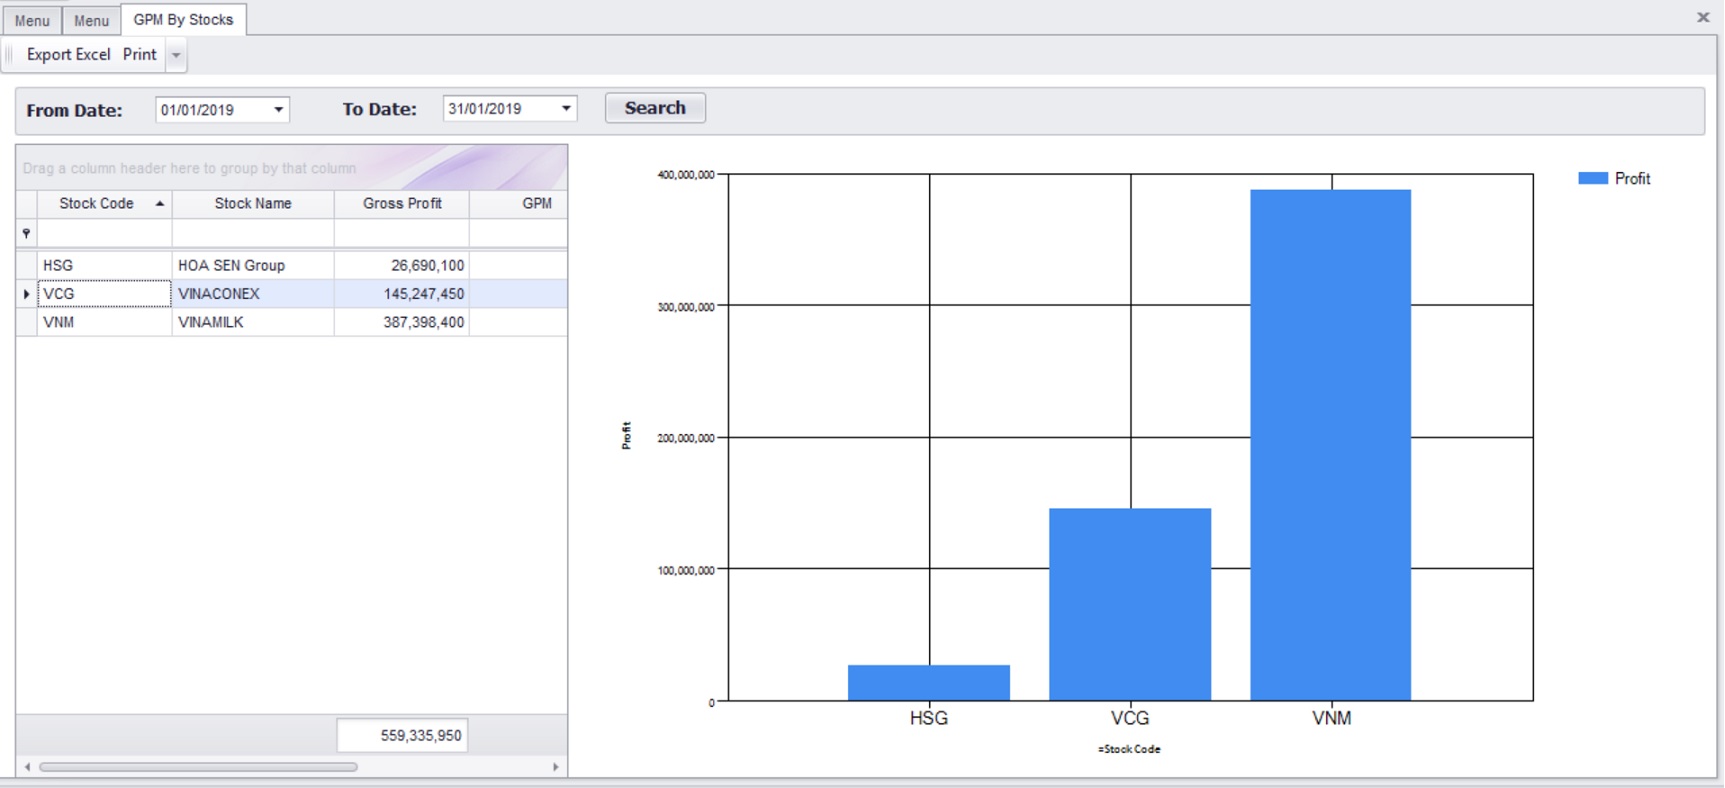
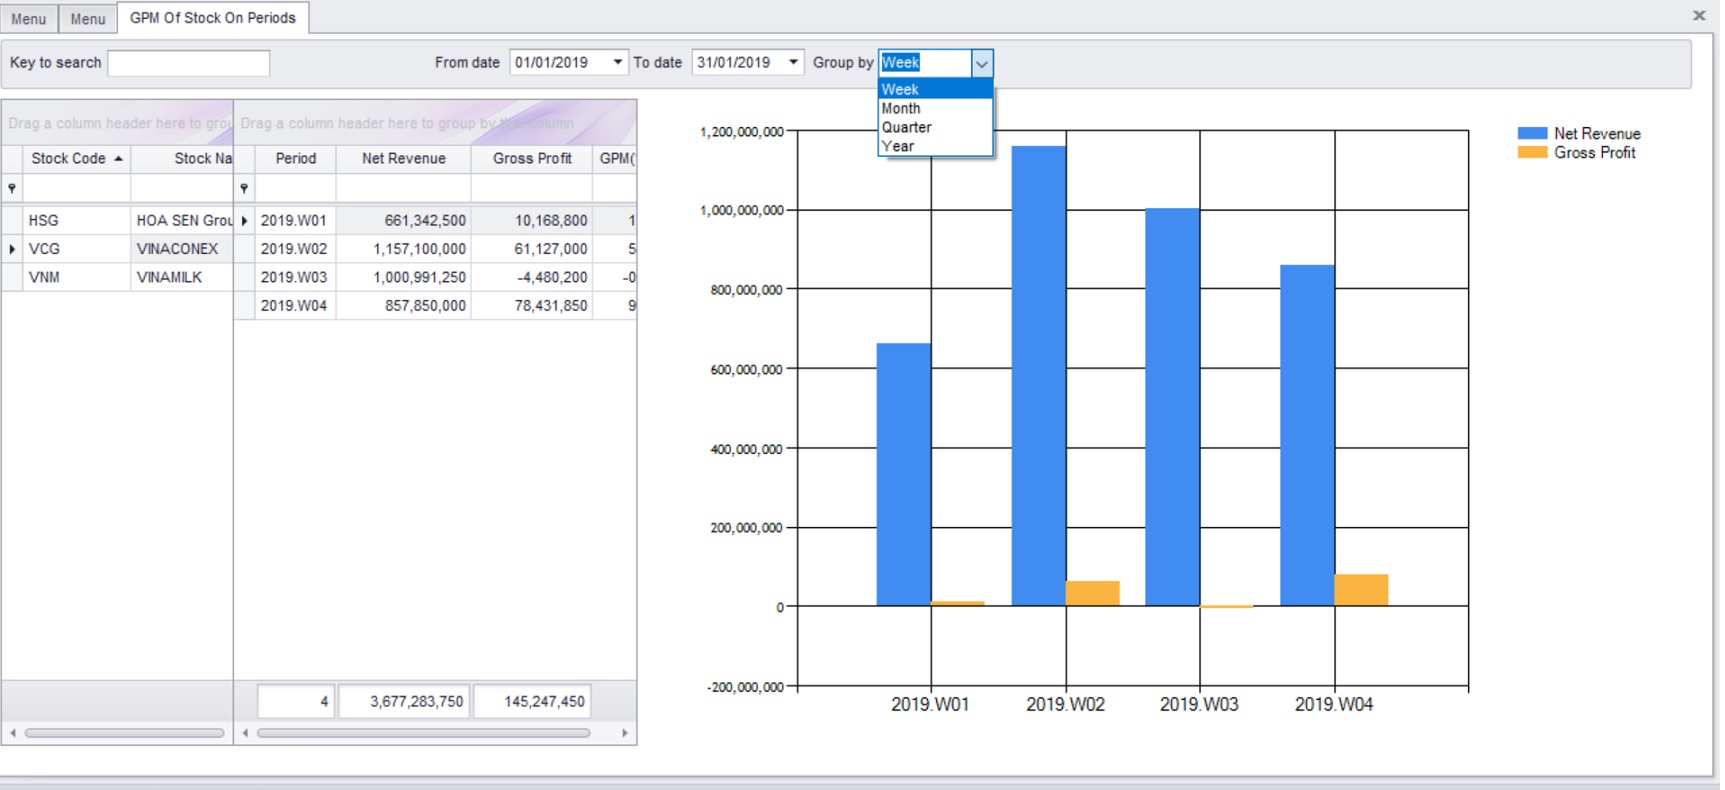
Analyzing the profit of each stock code and draw chart describing profit on each period by optional: week, month, quarter, year. Here in after is profit of VCG stock of first 4 weeks in 2019.
Similarly, if we move the cursor to HSG or VNM, there will be similar image results to analyze revenue and profit.
It is very useful and effective when analyzing data like this.